自然语言处理——新冠疫情期间Twitter情绪分析
通过爬虫、自然语言处理(主题模型、情绪分析)对疫情期间媒体报道主题和大众情绪的变化进行研究,并以Tableau仪表盘的形式对研究结果进行可视化展现。
原报告发表至Medium数据科学之路专栏。
项目代码发布至Github。
主要Taleau仪表盘如下:
Twitter整体情绪分析
基于新闻主题分类的Twitter情绪分析
以下为详细数据报告,包括:队伍介绍、项目动机、数据源、研究方法、研究成果及结论。

Team LightYellowDress&FluffyHair
This project was conducted Team LightYellowDress&Fluffy Hair in the University of California, Davis, MSBA program COVID-19 Challenge Competition. In this project, we utlized web scraping techniques to collect data from multi-platforms, leveraged NLP techniques to process the text data, analyzed the data by sentiment analysis and topic modeling, and created Tableau dashboard to present the results.
Motivation
The Corona Virus endangers our physical health indeed, but alongside, social distancing also poses a threat to our emotional stability. Thus, it is crucial to understand public sentiments under COVID-19.
Who will benefit from the analysis
-
Twitter: As a social media, Twitter takes the responsibility to control negative rumors spreading during this period for the social good. Twitter can monitor the sentiment trends and study the abnormal emotion peaks like what we did.
-
Medical Institutions: Our analysis can help medical institutions know the emotion changes during the COVID-19. Doctors can provide help to people who potential have mental health problem.
-
Business Owners: Keeping a watchful eye on trending topics and people’s emotion change can help business owners run marketing campaign appropriately and find out potential business opportunities, such as new services that needed by people.
The dataset can be used for
- The study of people’s interactions on Twitter during COVID-19 period
- The study of public media’s behavior during COVID-19 period
- The study of people’s emotion change during COVID-19 period
- More NLP data mining with plenty tweets during such specific period
Our data source including:
Confirmed Cases:
- Time searies data of confirmed cases: Johns Hopkins CSSE (daily data from 01/16 to 05/02)
Twitter:
- Tweets on Twitter retrieved with TwitterScraper API (daily data from 01/20 to 04/26)
Note: the daily data is a sample from each day’s tweets, not the population. We sampled out abough 13K tweets for each day, 1.3M in total. - Twitter trending topics retrieved by scraping Trendogate.com (daily data from 01/20 to 04/11)
- Number of tweets with #COVID-19 shared by Tweet Binder
News:
- #COVID-19 news scraped from Fox News (daily data from 01/20 to 04/26)
- #COVID-19 news scraped from CNN (daily data from 01/20 to 04/26)
The datasets can be found in folders. P.S. Due to the file size limitation set by Github, we did not upload the combined dataset. To combined the datasets in folders, please try:
1
2
3
4
5
6
7
8
# Read raw datas from the raw data file
path = r'------path-------------'
files = os.listdir(path)
covid_twitter_data = pd.DataFrame()
# Concat the Twitters data into one-table
for file in files:
    data = pd.read_csv(str(path) + file)
    covid_twitter_data = covid_twitter_data.append(data, ignore_index=True)
Analysis Methods
Sentiment Analysis
TextBlob Polarity & Subjectivity Score: We utilized TextBlob, a popular NLP library, to conduct sentiment analysis by generating polarity score (negative [-1 ~ +1] positive) and subjectivity score (objective [0 ~ 1] subjective). Examples:
- ‘Great!’ Polarity = 1
- ‘This is the worst situation.’ Polarity = -1
- ‘It’s raining.’ Subjectivity = 0
- ‘I love the rain!’ Subjectivity = 1

IBM Watson Tone Analyzer: We choose to use IBM’s Tone Analyzer (a cloud service) to do the sentiment anlysis because it can provide 5 different tones of the text data which is more than positive-negative sentiment analysis. Through this way, we can study the tweets’ emotion more specifically. The limitation of this service is that, for each account, we can only analyze 2,500 tweets/email for free, so this method cannot directly be deployed on the whole dataset we have.
Google BERT: To overcome the limitation of IBM Tone Analyzer, we firstly registered multiple emails accounts and utlized the Tone Analyzer to labeled a sample of data that we sampling randomly from the whole dataset. With adjustment and also combined with our manually labeled data, we used these data as trainning set for the Google BERT model, a state-of-art machine learning technique for classification. Compared to other alternatives, BERT requires much less time and less data to train, and yields better accuracy. It is a good fit for our case where we have limited training data.
LDA Topic Modeling
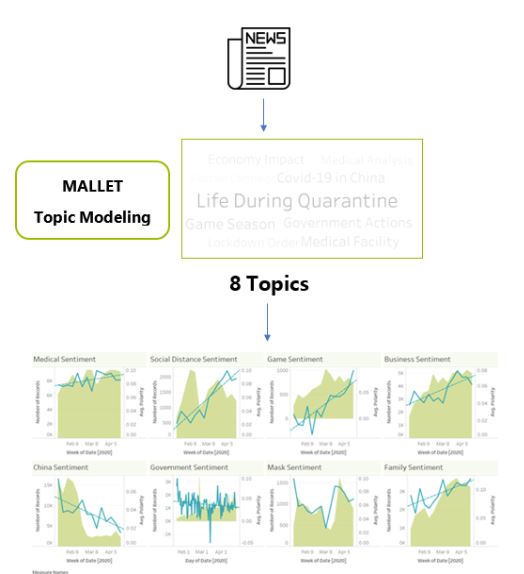
LDA Topic Modeling: We leverage LDA topic modeling technique to summarise the news articles we scraped. We clustered news articles in to 8 topics, including economical impact and political actions. Through this way, we can better understand how news articles responsed to COVID-19. The advantage of using news texts for topic modeling instead of tweets is that tweets are short, informal, and highly sentimental, which are hard to process for topic models, while news texts would capture the important events under COVID-19 in a formal and neutral way.
Limitation
Besides the IBM’s service limitation above, since evaluating a text tone is not a objective thing, the sentiment analysis we conducted is impacted by our subjectivity and the accuracy of IBM Tone Analyzer.
Analysis
1. Overview of #COVID-19 Tweets
Likes/Replies/Retweets of COVID-19 related Tweets
Since the first confirmed case was reported in January 2020, #COVID-19 and other similar tags have been trending on Twitter. With 1.3M+ COVID-19 related tweets (about 10,000+ per day) collected, we wondered how people on Twitter reacted to such tweets over time. Firstly, we explored some engagement metrics of tweets, such as the number of likes. The dashboard shows the average likes/replies/retweets per tweet on each day.
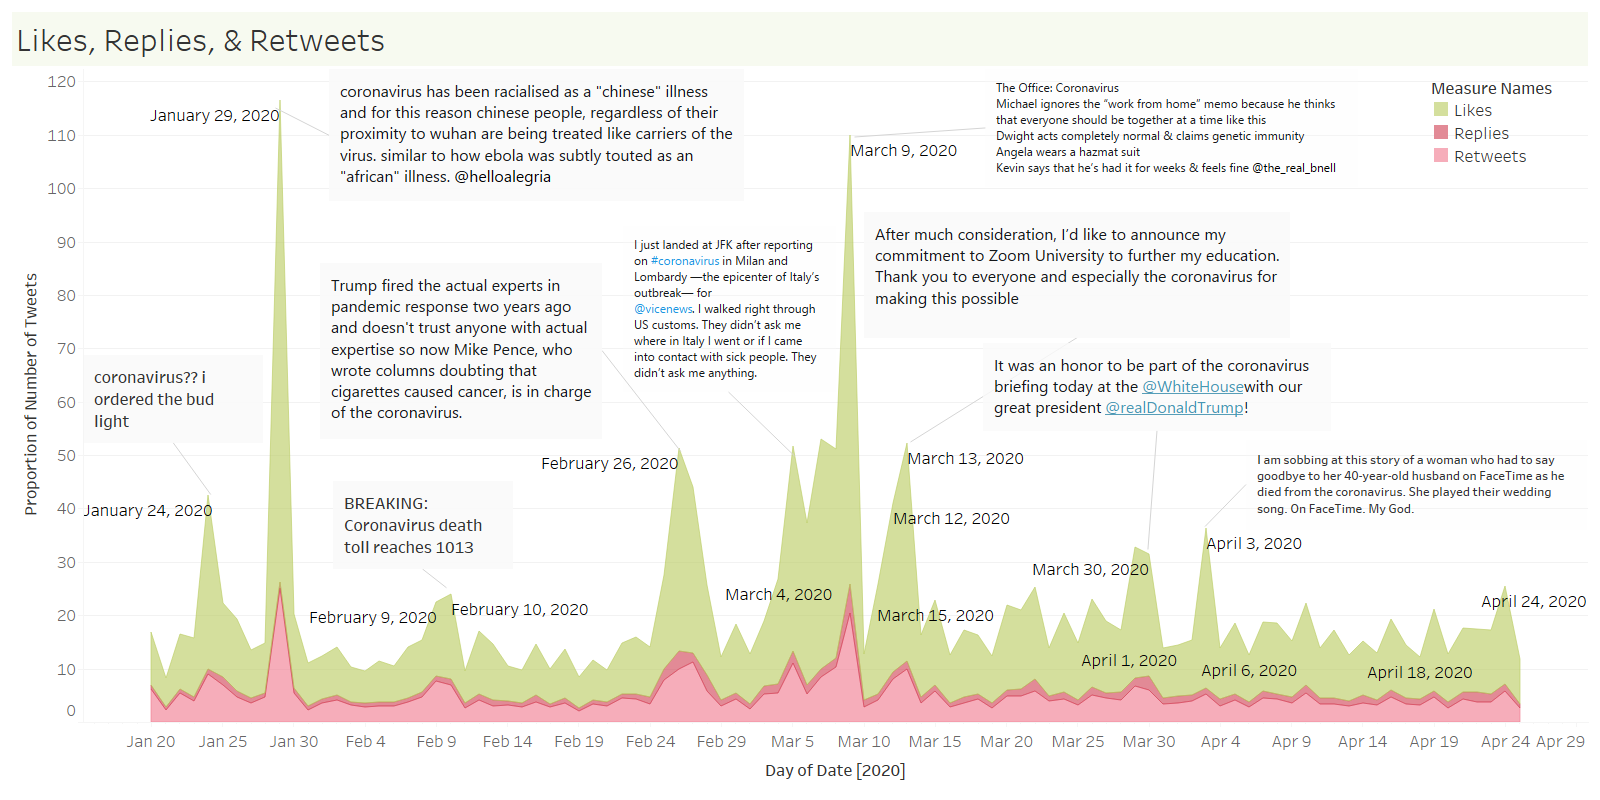
From the chart, we can tell that people reacted to some #COVID-19 tweets hotly on several days from January to March (e.g. Jan. 29, Feb. 26, and Mar. 9). The content of the tweets which received the most likes/replies/retweets changed from corona beer and COVID-19 in China to COVID-19 in the US and government’s actions. During late March and April, the average likes/replies/retweets per tweet tended to flatten, which indicates people on Twitter reacted or engaged in COVID-19 tweets less than they did previously.
2. Sentiment Analysis of #COVID-19 Tweets
Polarity & Subjectivity of COVID-19 related Tweets
Twitter is not only a place for people to respond to others’ tweets but also a platform to post your tweets and share your feelings. Thus, besides likes/replies/retweets, we also mined the content of COVID-19 related tweets to see how people’s feelings and expressions changed over time. With the help of TextBlob, a sentiment analysis library in Python, we extracted how subjective/objective (subjectivity) the content is and whether the content is positive or negative (polarity) for each tweet.
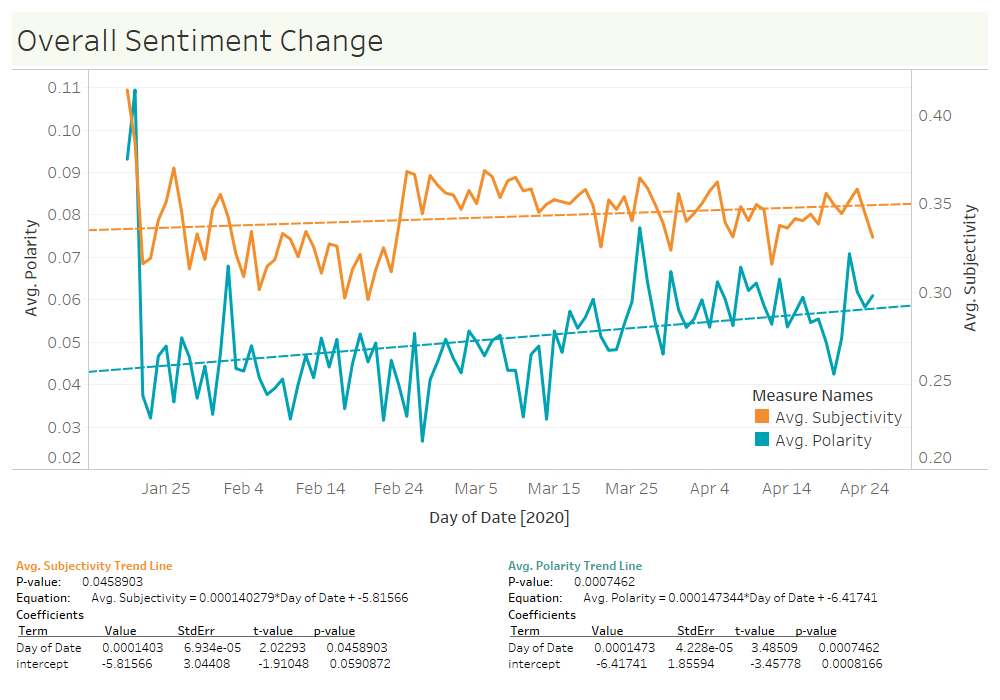
According to the chart above, with the development of COVID-19, the related tweets’ expression became more subjective (from about 0.33 to about 0.35) on average, and people’s feelings became more positive (from about 0.04 to about 0.06) on average. Why did this happen? Why with more and more people being infected with Coronavirus, the sentiment of related tweets went positive? With such questions, we went deep into what actual emotions the tweets reflected and what kinds of topics people talked about when mentioning this disease.
Five Emotions of COVID-19 related Tweets
We conducted further analysis by utilizing the BERT model. BERT is Google’s pre-trained model that can be fine-tuned for a wide range of NLP tasks (learn more). Here in our case, it was used in combination with IBM’s Watson Tone Analyzer (learn more) to label the tweets with 5 emotions. The five emotion are:
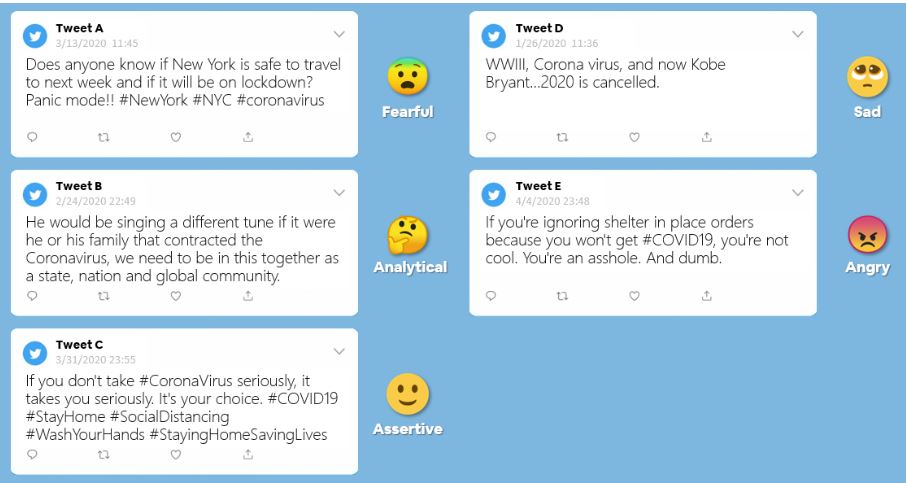
After putting our model results back to the timeline under the pandemic context (we used the growth rate of the accumulated number of confirmed cases to reflect the spread of the disease), we summarized some interesting findings.
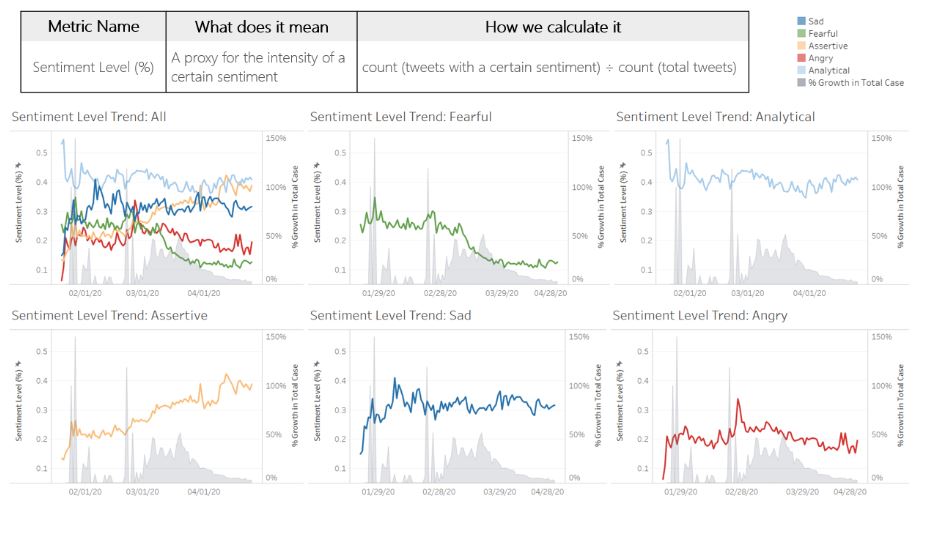
Before the first confirmed case in the U.S. was reported (Jan 21th), sentiment “Analytical” was detected most in tweets, other Sentiment Levels remained low. Right after the first case reported, mixed sentiments arose, which indicates increasing social awareness of the pandemic. “Sad” is volatile but remains relatively high after it went up in January. In late February, different sentiments tended to diverge, “Assertive” increased, “Fearful” went down. Overloaded with information seems to have made people less sensitive.
Since one tweet can possess more than one sentiment, we also computed the Sentiment Density to show that on average how many different sentiments a tweet had on a single day. This figure will give us a direct impression of how much the tweets were “packed with” different emotions on a day. We then computed the day-on-day change of these metrics and formed the delta metrics.
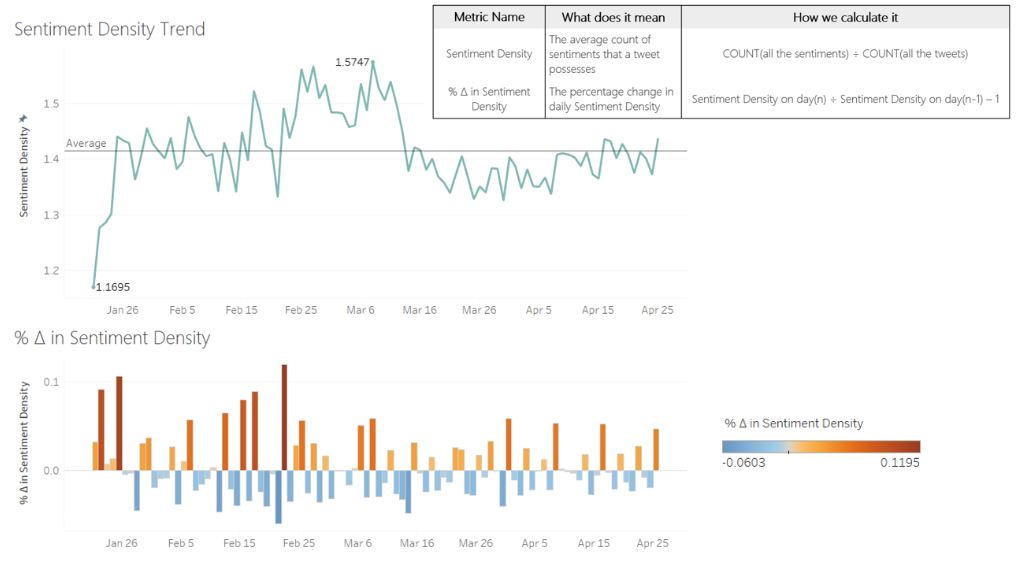
Through the general trend of Sentiment Density in the above dashboard, we can infer that from late February till mid-March, people were undergoing the densest sentiments, especially in terms of the negative feelings, followed by the period of late January to mid-February. In April, the Sentiment Density decreased and stayed in a lower position, but it was still higher than that of the beginning.
3. Analysis on Topics
After studying the general trend of sentiments during the researched period, we wanted to add another layer of information to dissect the overall trend. We intended to extract some hot topics that people discussed when talking about COVID-19 and how the polarity (positive/negative) changed under each topic, so we firstly extracted several topics from the COVID-19 related news and then leveraged the keywords in those topics to classify tweets.
We utilized Mallet, a natural language processing toolkit, to perform Latent Dirichlet Allocation (LDA) topical modeling, and summarized 8 topics. We named these topics by summarizing the topic keywords returned by the model, and they are as follows (following the descending sequence of frequency): Life during COVID-19, Covid-19 in China, Lockdown Order, Medical Tests & Analysis, Government Actions, Game Season, Economy Impact, Medical Supply. Equipping with the TextBlob’s sentiment analysis, the trendings of these topics over time are as follows:
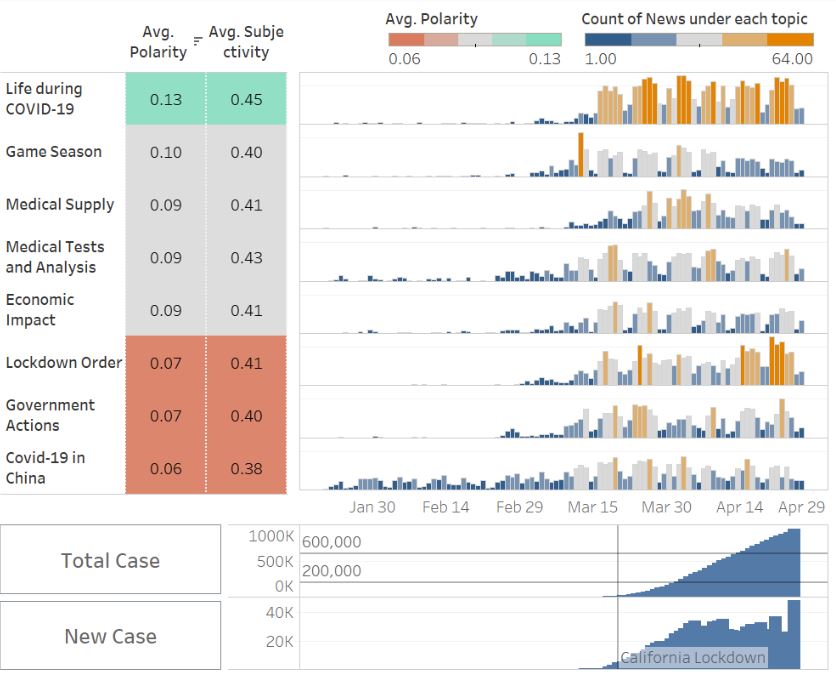
Different topics cover different time periods, and most resonate with the fact. For example, before March, only a few topics like COVID-19 in China appeared in coronavirus-related news. After March, owing to the widespread of COVID-19, the number of related news began surging, especially for topics like Medical Tests. One interesting finding is that, with the execution of lockdown order since mid-March, the news about Life during COVID-19 peaked as the majority of news with the highest average polarity score.
For the sentiment of these topics in news, the topic Life during COVID-19 is undoubtedly the most positive as well as the most objective topic among all the topics, followed by the band containing Game Season, Medical Supply and Medical Tests and Analysis. However, the topic COVID-19 in China, on the other hand, got the most negative and subjective wordings.
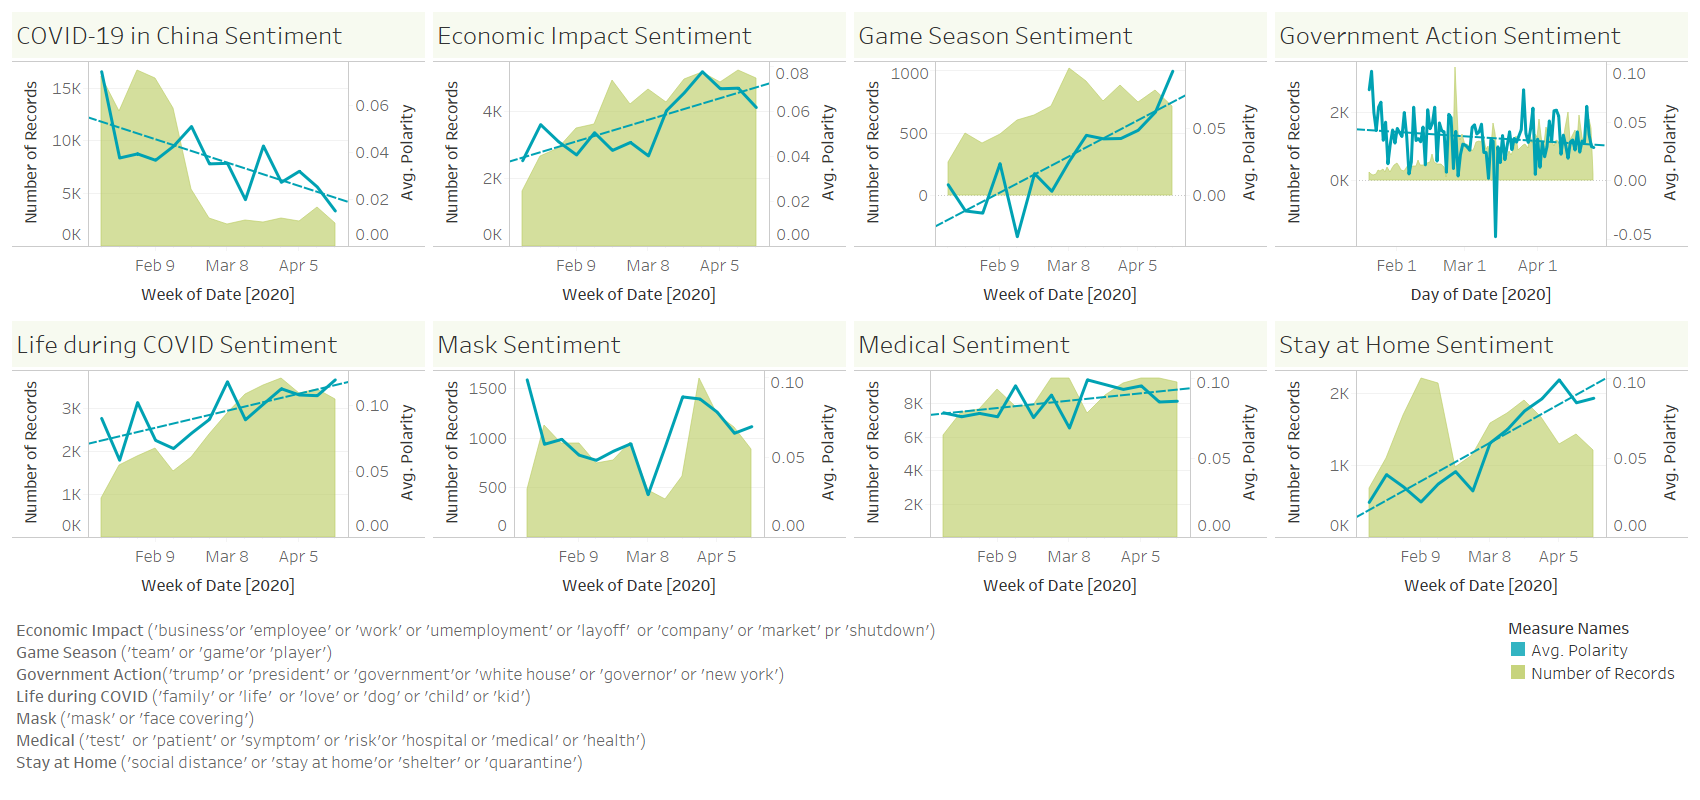
With the topics summarized by the news topic modeling, we used corresponding keywords to classify tweets. After filtering tweets by keywords (described in the chart), suggested by the 8 topics, and the topic trends are shown below:
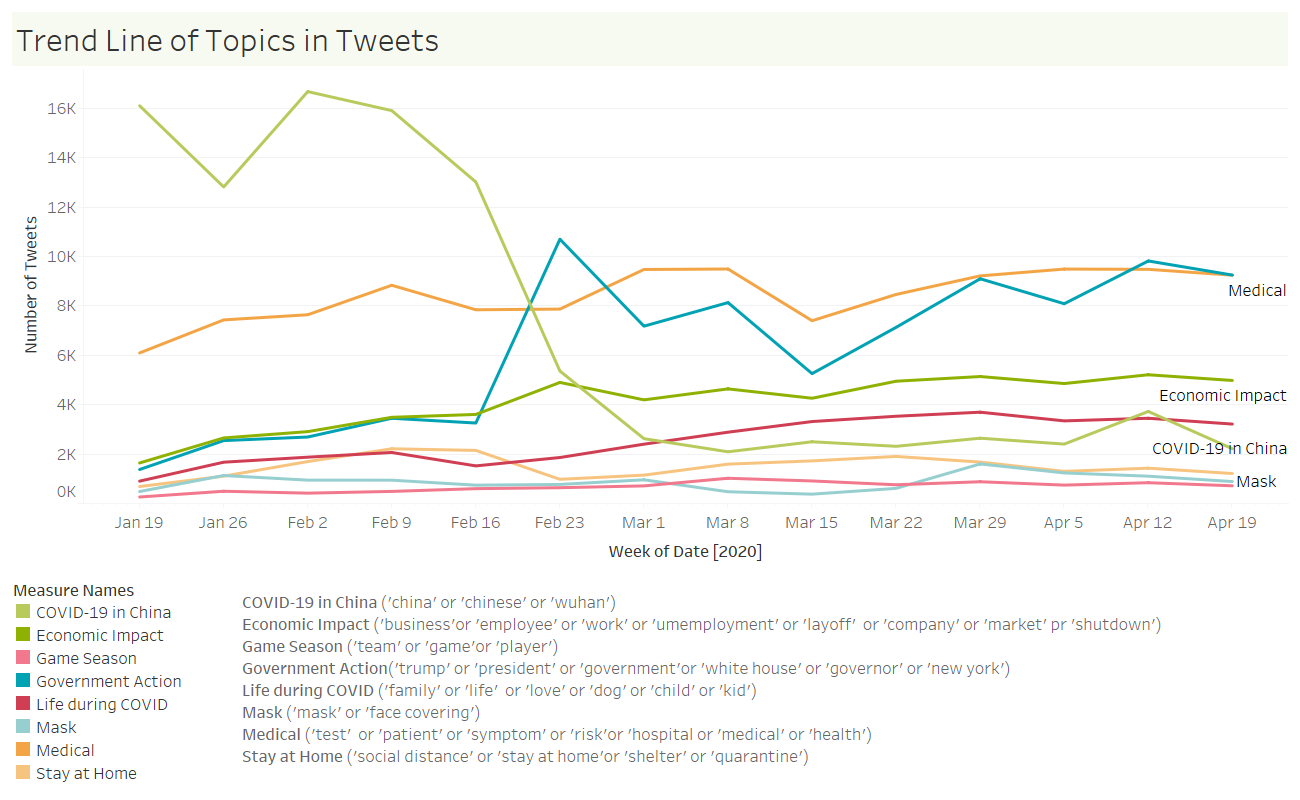
The same trend of news topics applies here as the trend of tweets mentioning COVID-19 in China peaked before March and began decreasing since the first case in the US. As shown in the graph, the public paid more and more attention to government actions over time. Medical-related, economic impact, and life during COVID topics increased slowly. As for the game season, mask, and stay at home topics did not show an obvious upward trend over time.
Topics Sentiment Analysis on Tweets

When analyzing the sentiments, we can see an increasing positivity in most topics. The topic that has the highest positivity is still about Life during COVID-19. And one trend that has the fastest positivity growth rate is the sentiment about stay at home, which echoes the point brought above that people are getting less sensitive during the quarantine. For the debating topic about the facial mask and the stay at home, we can see the polarity went down first at the beginning of the COVID-19 outbreak but went up later during March. The tweets talking about government-related issues tended to have a very fluctuant sentiment trend line, and the polarity went down on the whole. Recently, more and more tweets talking about economic impacts, such as layoffs and unemployment, but the overall sentiment trend towards positive. For the game season, many games were canceled due to the coronavirus so the sentiment of those tweets was not very positive. Lastly, the tweets mentioning ‘China’ became more negative over time.
Conclusions
Our analysis has shown some relationships between confirmed cases growth and the trends of sentiments. With more granular data such as geographic data, demographic information and so on, further insights can be generated, such as public sentiment monitoring the hardest-hit areas. With a more specific target, the analysis would be more valuable for institutions or governments to take action.
In this project, we analyzed the sentiments of COVID-19-related tweets in several ways. The overall trend shows that the public has been more optimistic over time. Digging into the multi-dimensional sentiment analysis, we found that the sentiment “Assertive” went up and “Fearful” went down through the time. Besides, the Sentiment Density indicates that the public turned out to be less loaded with emotions. At last, the topics behind the sentiments unfolded more details.
To fight the coronavirus not only needs the guidance from the government but also a positive attitude from the public. Our analysis provides a potential approach to reveal the public’s sentiment status and help institutions respond timely to it.
Acknowledge
We want to sincerely acknowledge the efforts of the faculty and student executive assistants of UC Davis MSBA program for facilitating the COVID-19 Challenge. Also we are very grateful to the valuable suggestions from Prof. Ashwin Aravindakshan and Prof. Jörn Boehnke.